Priority Pathogens List
Published: 2025-05-28
Objectives
The objectives of generating a priority pathogens list are:
- Aggregate pathogen prioritization lists from leading public health and research organizations.
- Provide a unified reference with consistent taxonomy and annotation.
- Support pathogen surveillance, pandemic preparedness, and biosecurity efforts.
- Make prioritization data machine-readable, as many official lists are only available in formats (PDFs or websites) that are not readily accessible for automated analysis.
All this information can be found in Github
Methodology
Taxonomic standardization
- Pathogens are named using scientific species names whenever possible.
- When species-level resolution is not feasible, the genus name is used.
- Viral naming follows ICTV (International Committee on Taxonomy of Viruses) recommendations.
- Additional or common names are listed under the
also_known_asfield.
Data sources
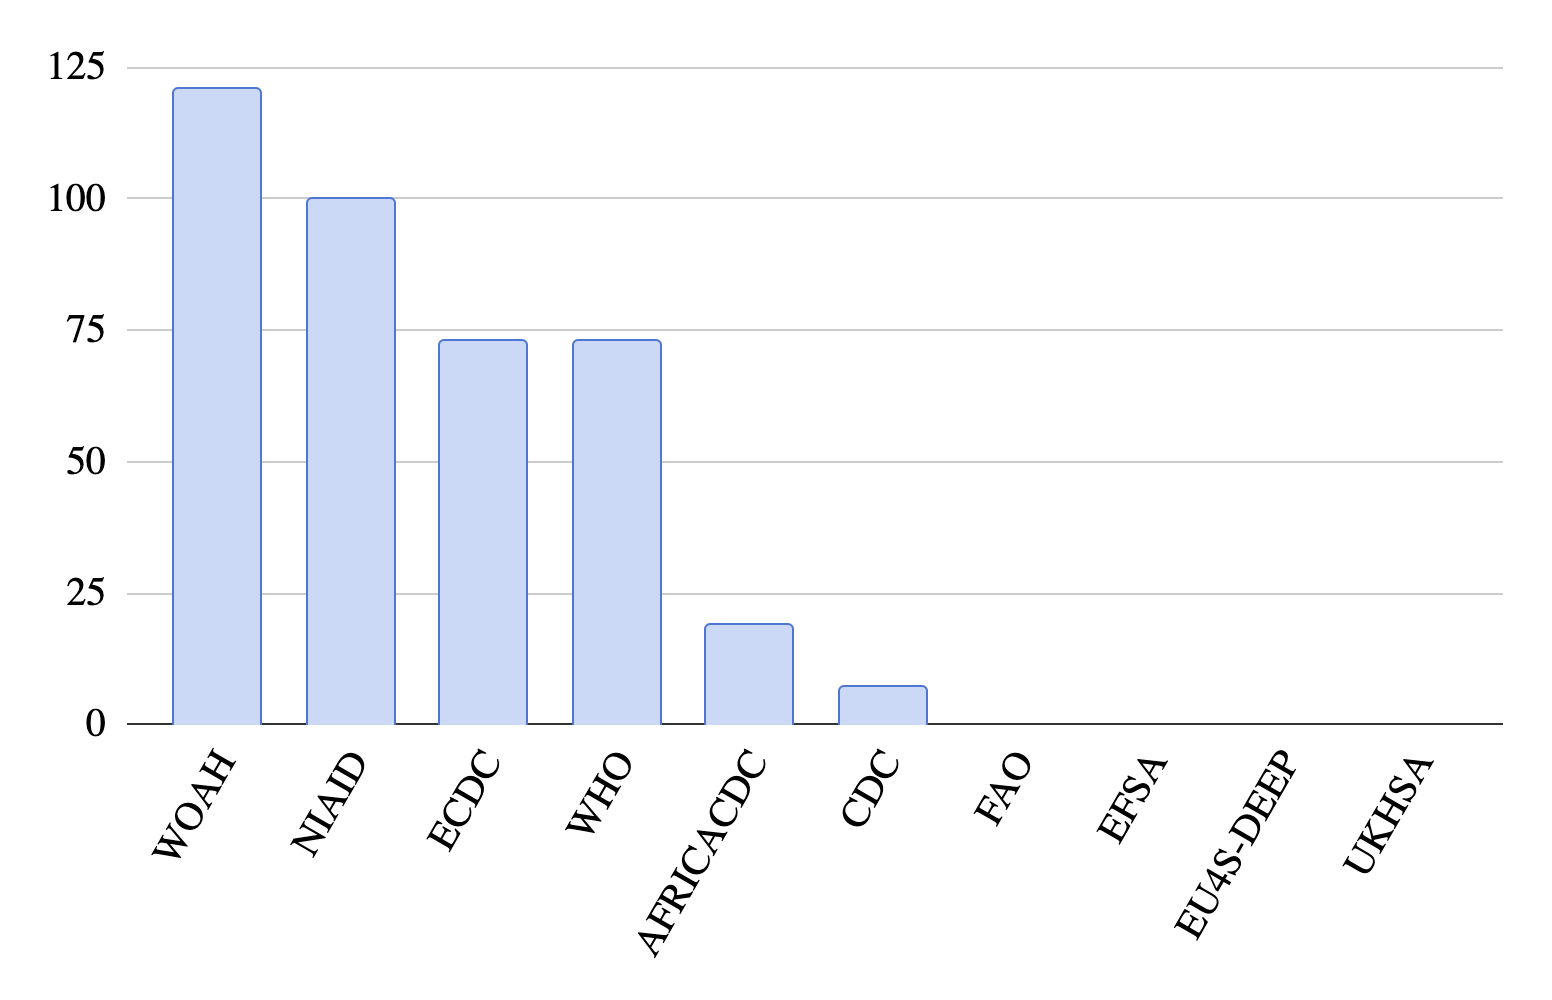
The prioritization list integrates information from international and national agencies, using their publicly available priority lists. Each source is referenced below:
| Organization | Acronym | Link | List Name | Source URLs |
|---|---|---|---|---|
| National Institute of Allergy and Infectious Diseases | NIAID | niaid.nih.gov | NIAID Biodefense Pathogens, Research, Wiriya's document | [1], [2], [3] |
| European Centre for Disease Prevention and Control | ECDC | ecdc.europa.eu | Disease-based list | Link |
| World Health Organization | WHO | who.int | WHO priority pathogen lists (scientific framework, bacteria, fungi) | [1], [2], [3] |
| Africa Centres for Disease Control and Prevention | AFRICACDC | africacdc.org | Epidemic-prone diseases prioritization | Link |
| Centers for Disease Control and Prevention (USA) | CDC | cdc.gov | AMR Threats Report 2021-2022 | Link |
Priority Type Classification
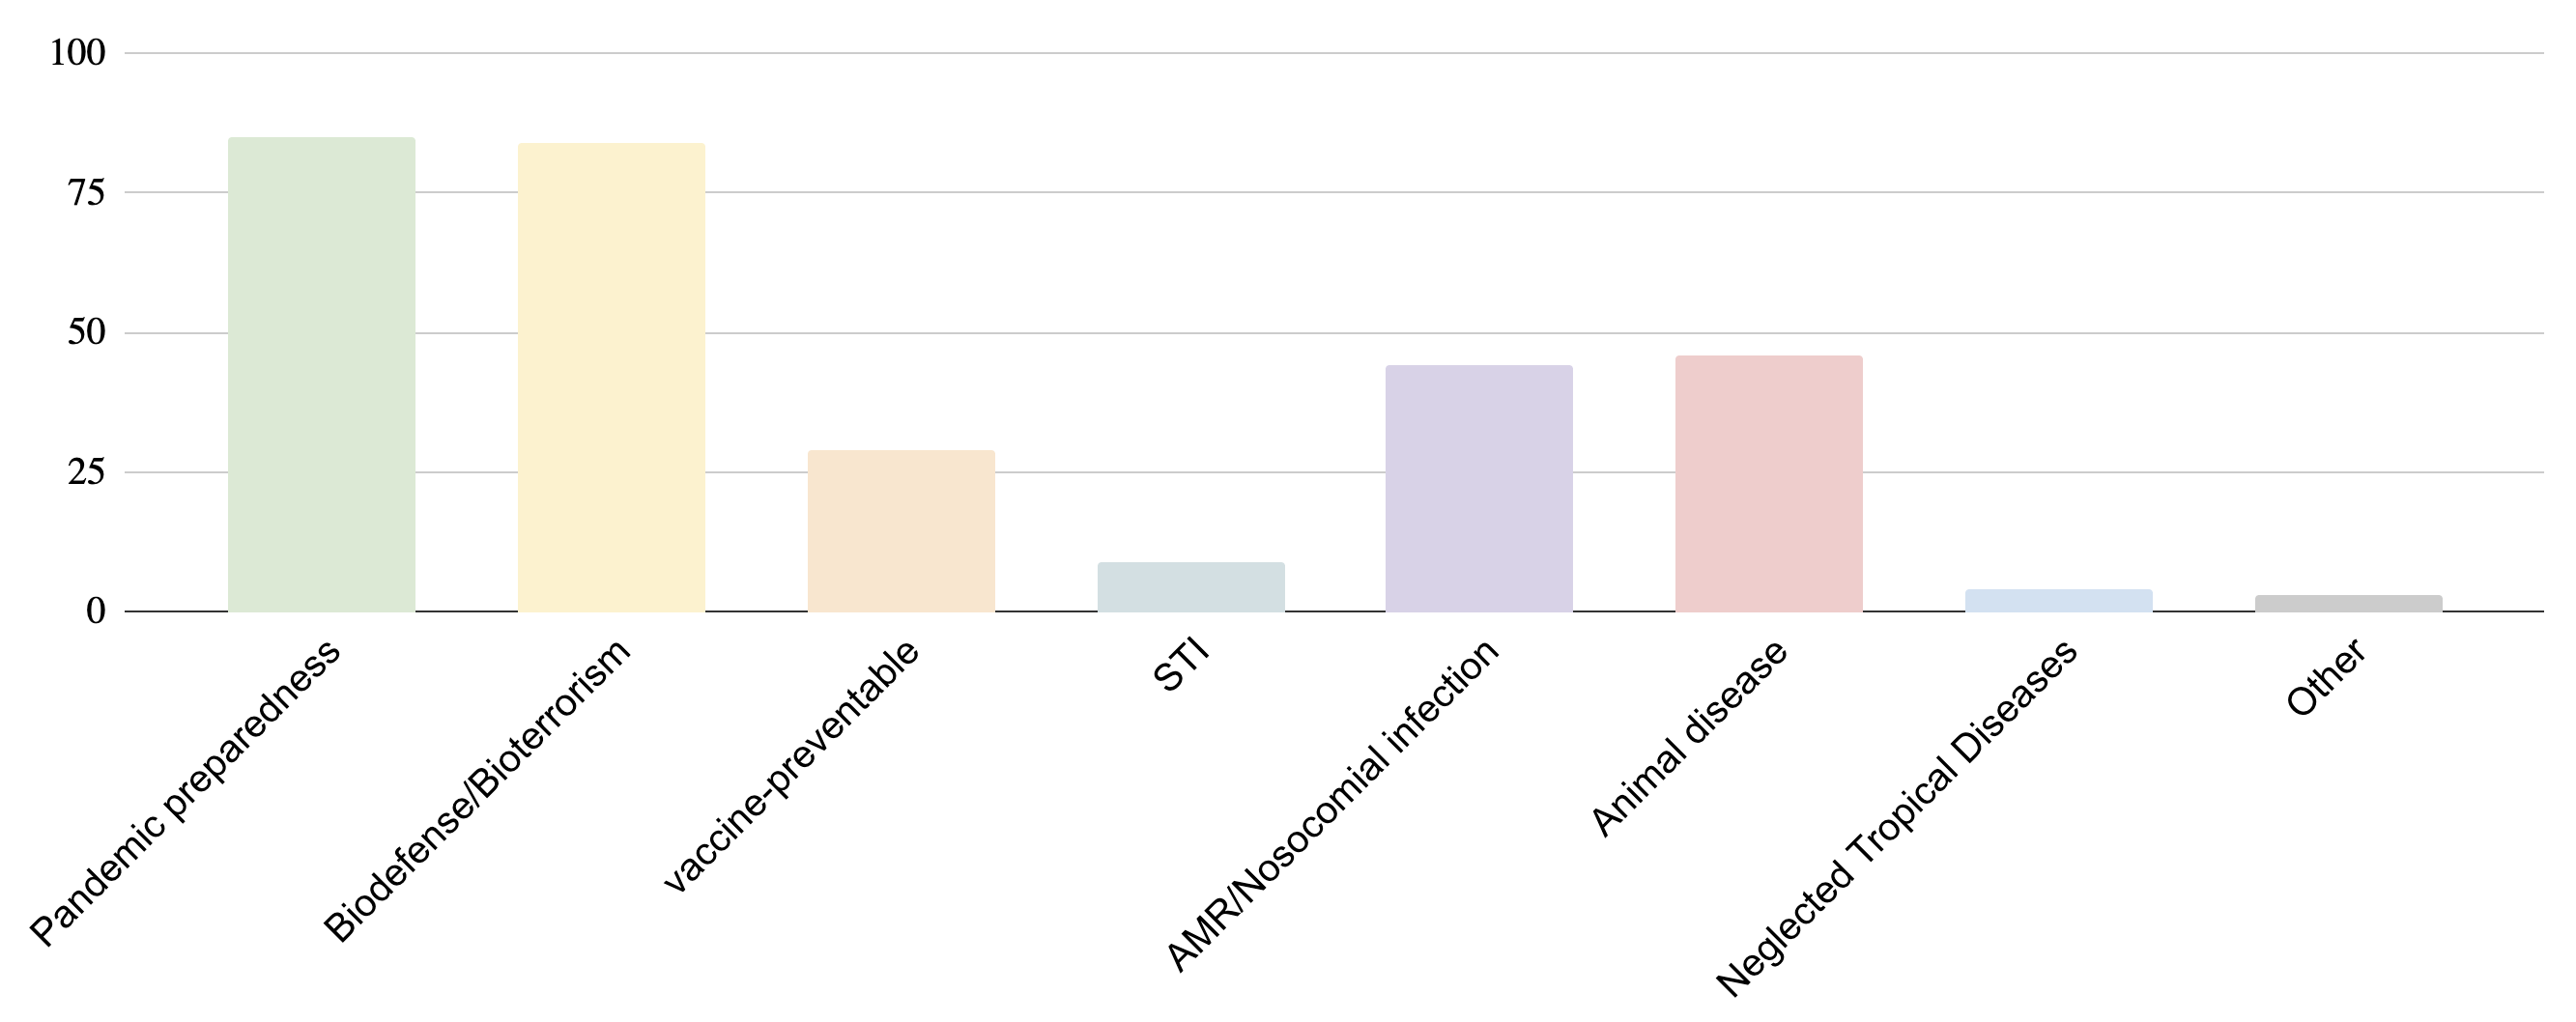
Each pathogen is categorized into one or more “priority types”, based on its inclusion in the above lists. These allow grouping pathogens by relevance across thematic areas.
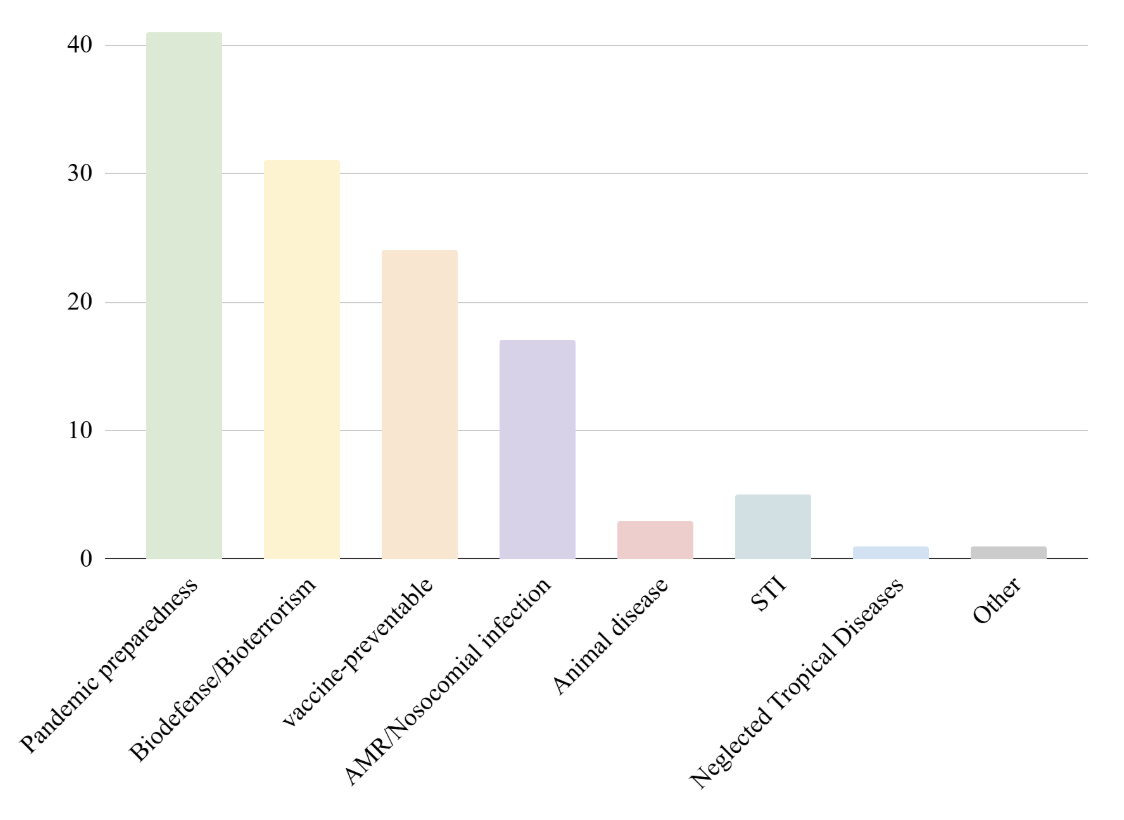
Unique priority types used:
- Pandemic preparedness
- Biodefense/Bioterrorism
- Vaccine-preventable
- STI
- AMR/Nosocomial infection
- Animal disease
- Neglected Tropical Diseases
- Other
Prioritization logic
Inclusion criteria
-
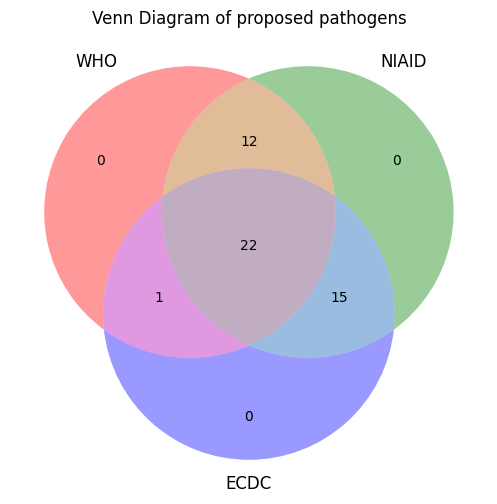
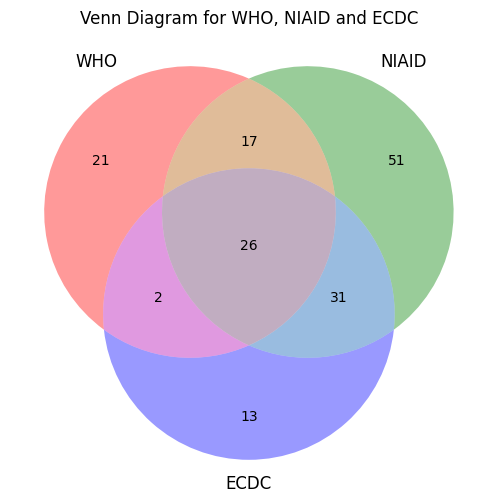
Included if the pathogen appears in at least two of the following global health agency lists: WHO, NIAID, ECDC.
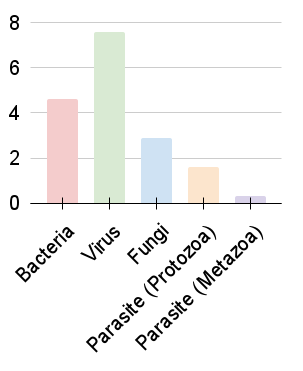
- Note: Fungal pathogens are only prioritized by WHO and NIAID and are not present in ECDC or Africa CDC lists.
- Additionally, the pathogen must be listed under at least two distinct priority categories, excluding "Animal disease".
Score and ranking
Each pathogen is assigned a composite –priority score–, calculated based on:
- Number of appearances in key organizational lists (WHO, NIAID, ECDC) ×1
- Number of appearances in broader organizational sets (WHO, NIAID, ECDC, AFRICACDC) ×2
- Number of different priority types (excluding "Animal disease") ×1
- Whether the pathogen has been detected in wastewater monitoring ×1
-
Additional adjustment for underepresentation:
- Fungi: +3
- Protozoan parasites: +4
This score is stored in the field priority_score.
The full ranked list is available in complete_priority_pathogens.json, including the computed priority score and the derived priority_order.
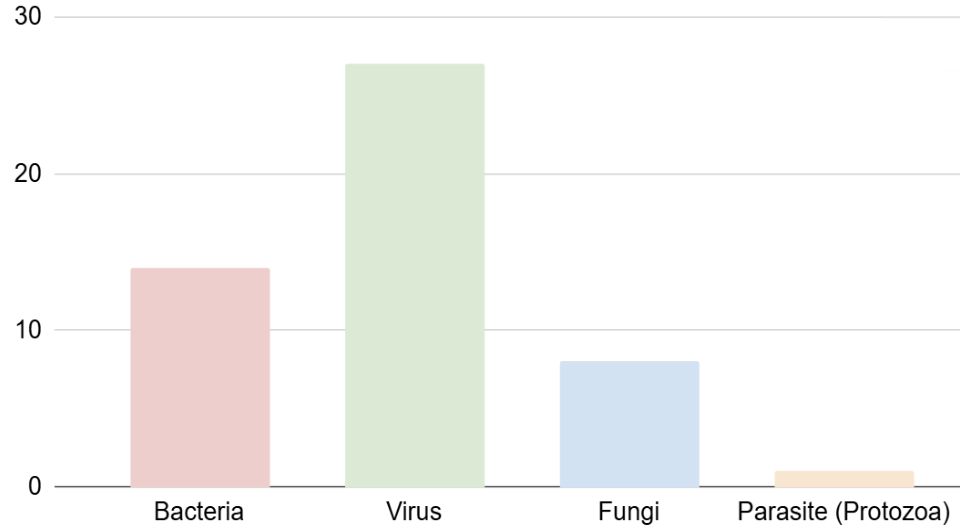
Final selection
- A total of 50 pathogens from 33 families were retained after filtering.
- From this list, a subset of 22 pathogens is selected for PDN priority consideration, based on the inclusion criteria.
- Pathogens with a priority score ≥ 12 are marked with
highest_priority: true.